Facebook
 X
X
 Pinterest
 Copy Link

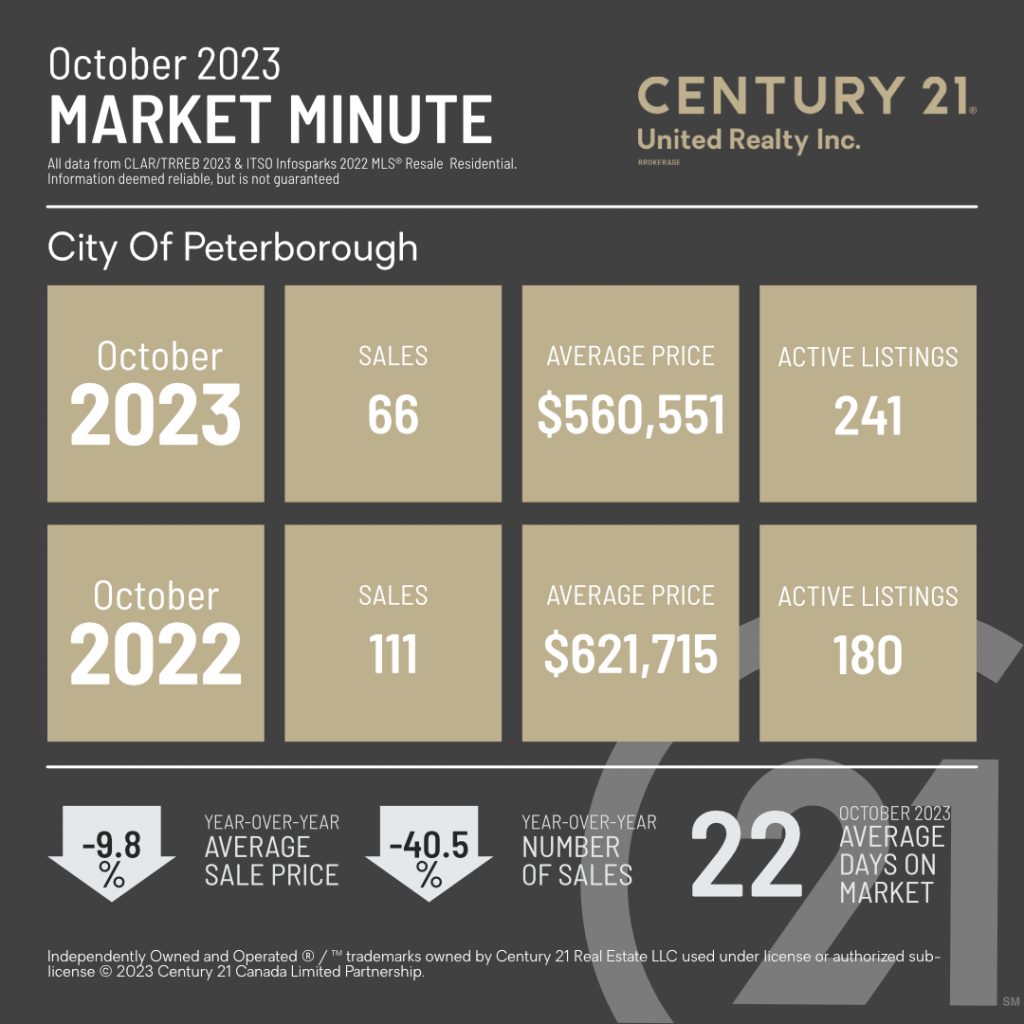
In the dynamic world of real estate, staying informed about market trends is crucial for both buyers and sellers. October 2023 has brought significant changes to the real estate landscape in Peterborough, revealing intriguing insights into the market’s health and direction. In this blog post, we’ll delve into the statistics from October 2023, comparing them to the same period in 2022, to provide a comprehensive analysis of the current real estate scenario in the city of Peterborough.
Shift in Sales Volume: A 40.5% YoY Decrease
One of the most striking aspects of the October 2023 real estate market in Peterborough is the substantial decline in the average number of sales. In 2022, the city saw an average of 111 sales per month, whereas in 2023, this number dropped to 66. This stark 40.5% year-over-year decrease in sales indicates a shift in market dynamics, potentially influencing both buyers and sellers.
Price Fluctuations: Understanding the 9.8% YoY Decrease
Accompanying the decline in sales volume is a notable 9.8% year-over-year decrease in the average sale price. In October 2022, the average price stood at $621,715, whereas in October 2023, it dropped to $560,551. While a decrease in average sale price might raise eyebrows, it’s crucial to approach this statistic with a nuanced perspective. Factors such as inventory levels, economic conditions, and local market trends can all contribute to fluctuations in property prices.
Active Listings Surge: 33.9% YoY Increase
Examining the number of active listings is key to understanding the supply and demand dynamics in the real estate market. In October 2023, Peterborough had 241 active listings, representing a substantial 33.9% increase from the 180 listings in October 2022. This surge in available properties could contribute to the decrease in average sale prices, as increased supply often exerts downward pressure on prices.
Speed of Transactions: Average Days on Market (DOM)
Another noteworthy metric in assessing the health of a real estate market is the average number of days a property spends on the market before being sold. In October 2023, Peterborough recorded an average DOM of 22 days. This suggests a relatively swift pace of transactions, which can be attributed to factors such as high demand, competitive pricing, and a well-functioning real estate ecosystem.
The October 2023 real estate statistics for Peterborough, Ontario, paint a picture of a market in transition. The significant decline in sales volume and average sale prices, coupled with a notable increase in active listings, indicates a shift in the balance between supply and demand. For both buyers and sellers, adaptability and a nuanced understanding of these trends are paramount. As we move forward, keeping a close eye on market indicators will be essential for making informed decisions in this ever-evolving real estate landscape.
As always, it’s essential to stay informed and seek the advice of experienced real estate professionals when making decisions in the current market. Need help to decide your next move? Don’t know what these numbers mean for you? We always have an agent on duty to help you. Call our office at 705-743-4444 and we will be happy to direct you to a REALTOR® to answer your questions.
*All data from ITSO. InfoSparks®© 2023 ShowingTime MLS® Resale Residential. Information deemed reliable but is not guaranteed.
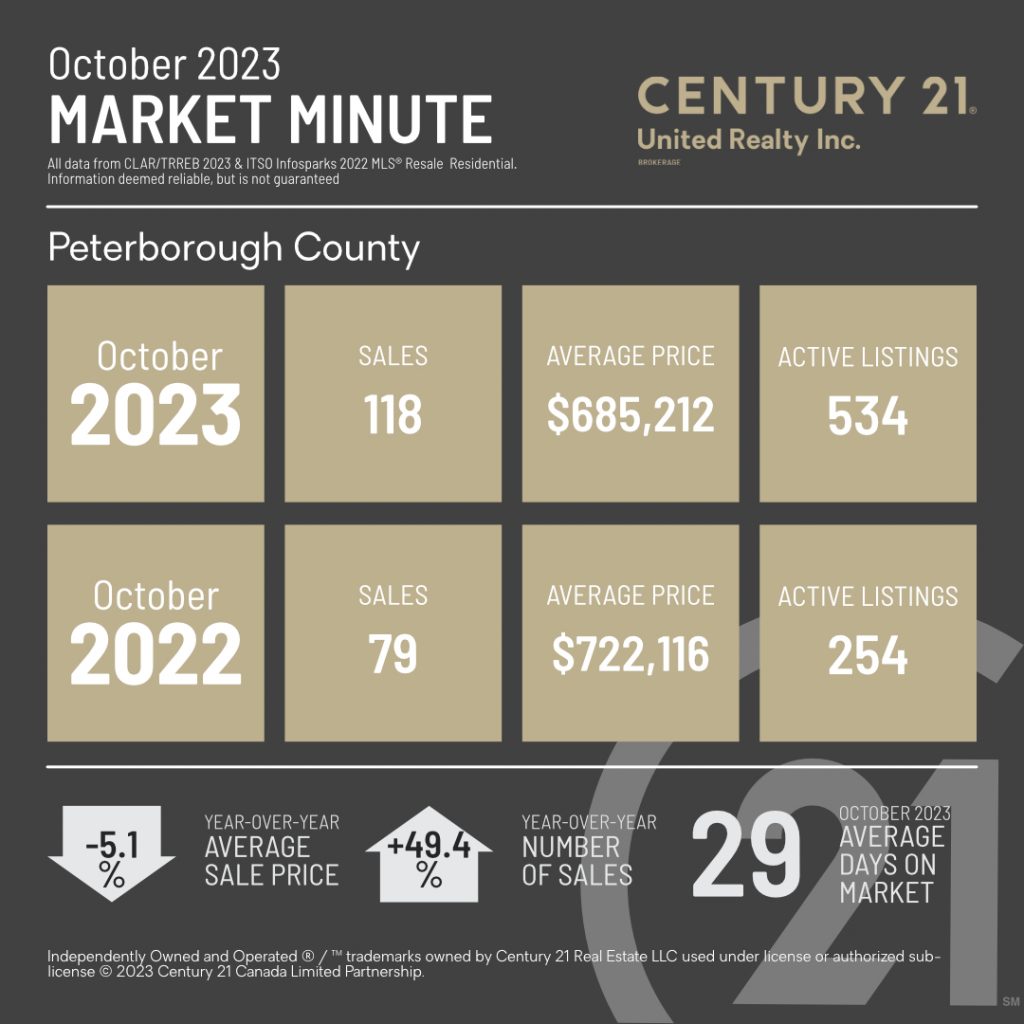
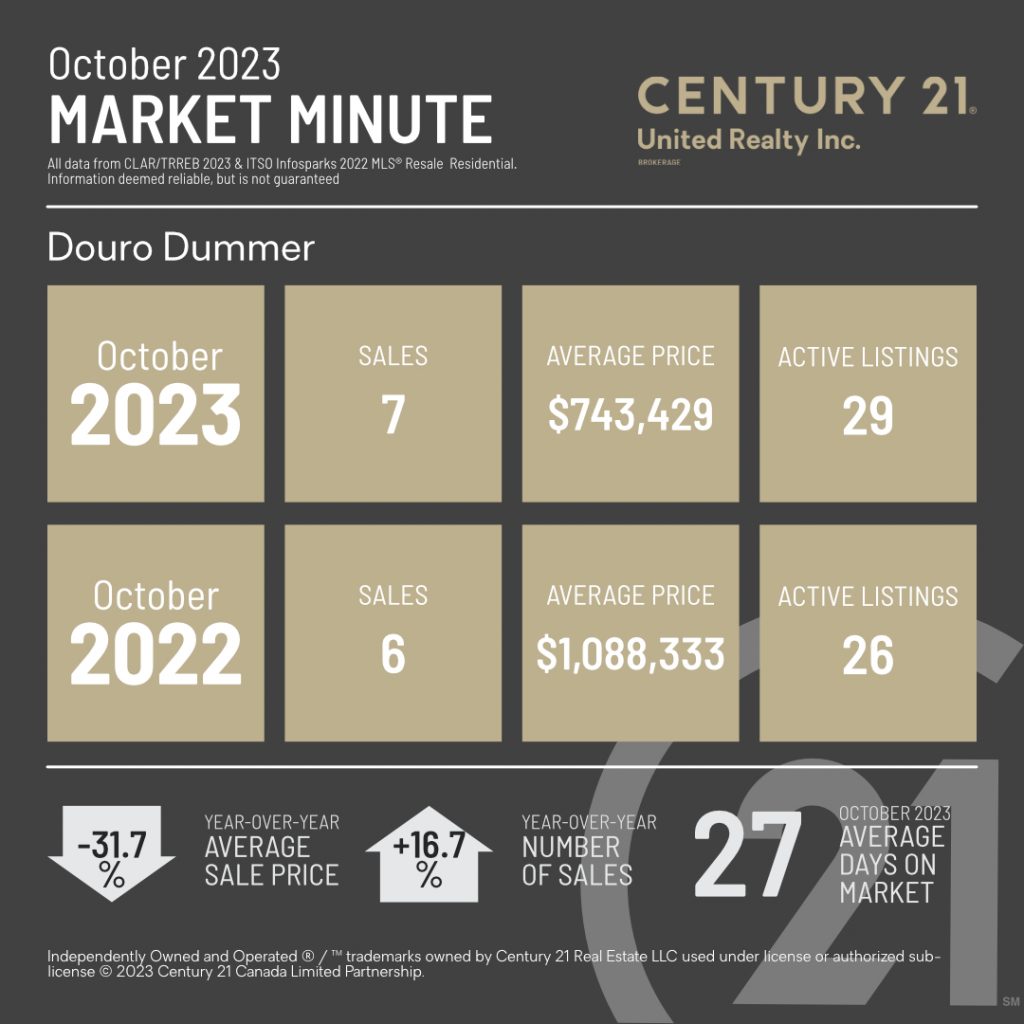
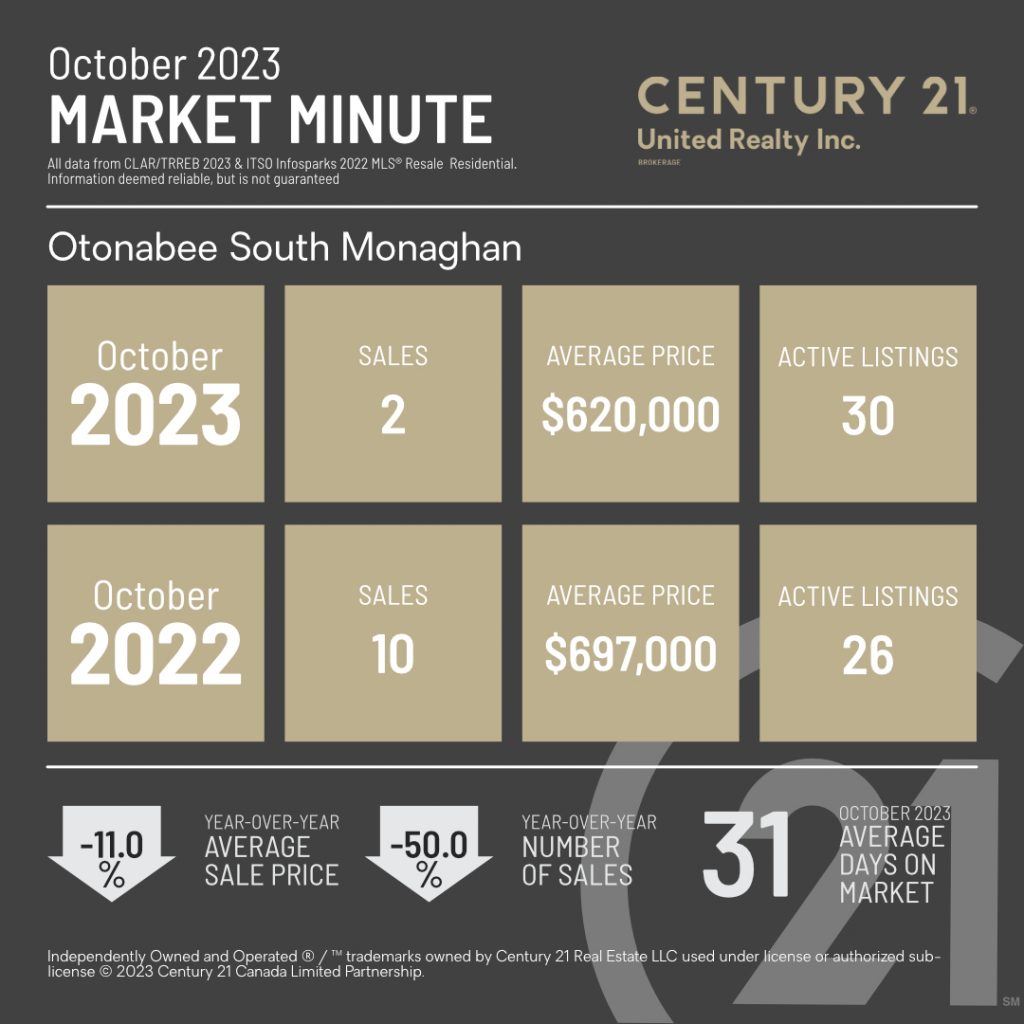
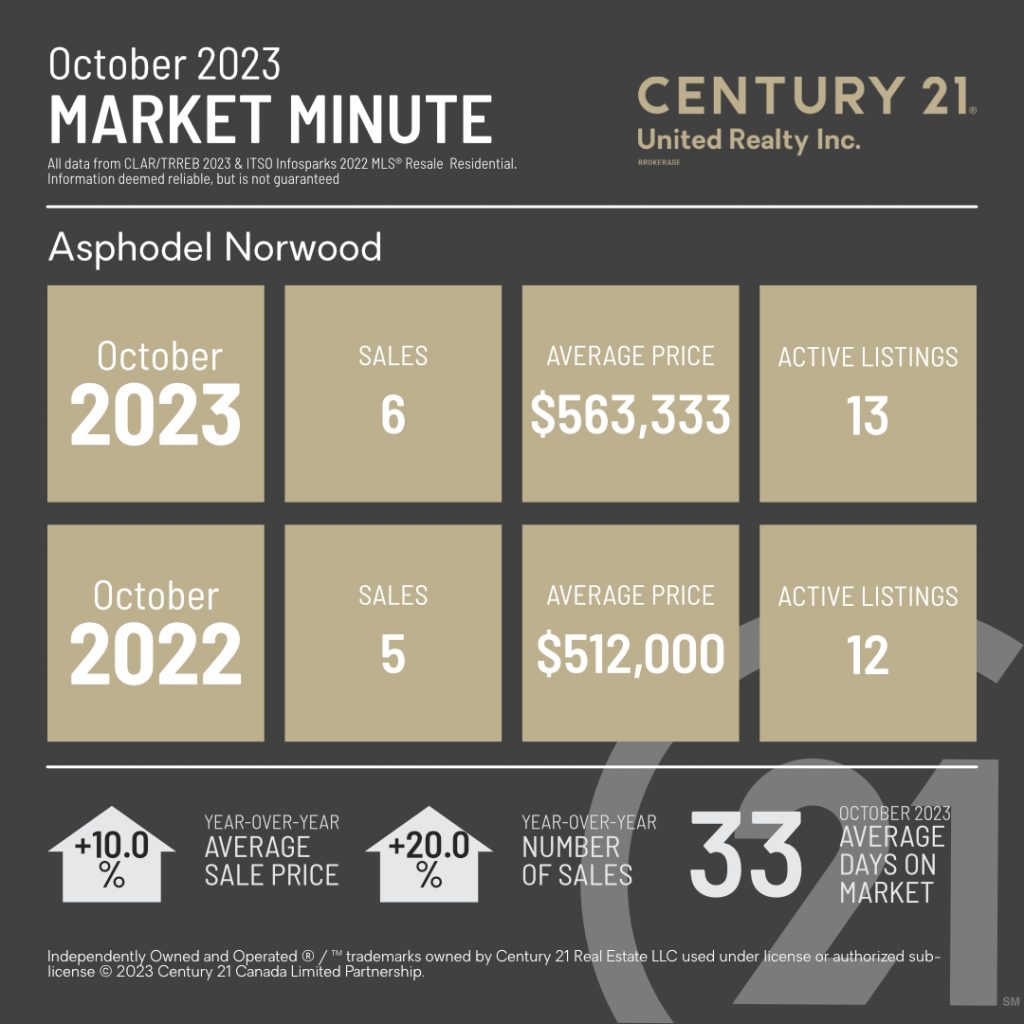
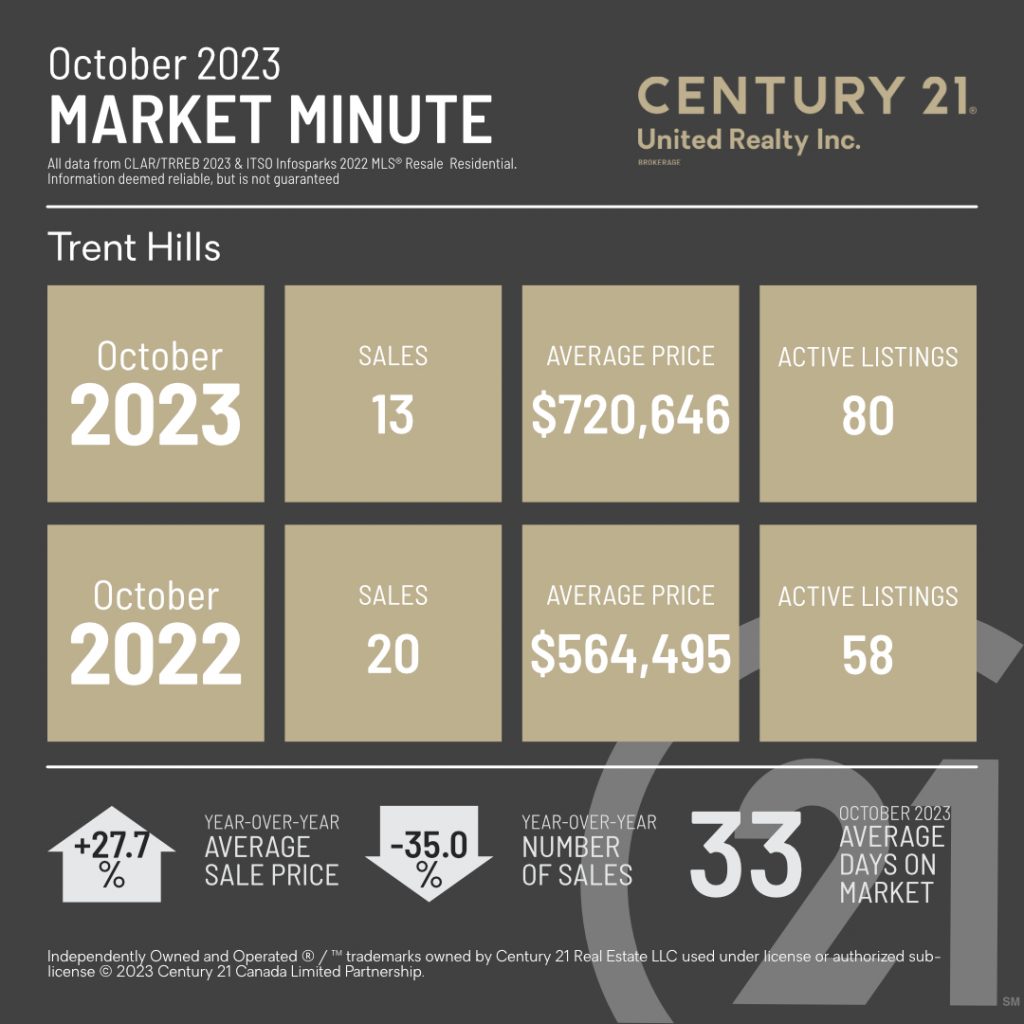
Highlighted below are some of the major areas we cover with our stats: